Populate jqxChart with data from ASP .NET Web Service
In this post we are going to show you how to bind jqxChart to ASP.NET Web Service.
- Create a new ASP.NET Web Application.
- Add the following files to the Scripts folder.
jqxchart.js, jqxcore.js, jqxdata.js and jquery-1.11.1.min.js.
- In the "Styles" folder add the "jqx.base.css" and "jqx.classic.css" CSS files.
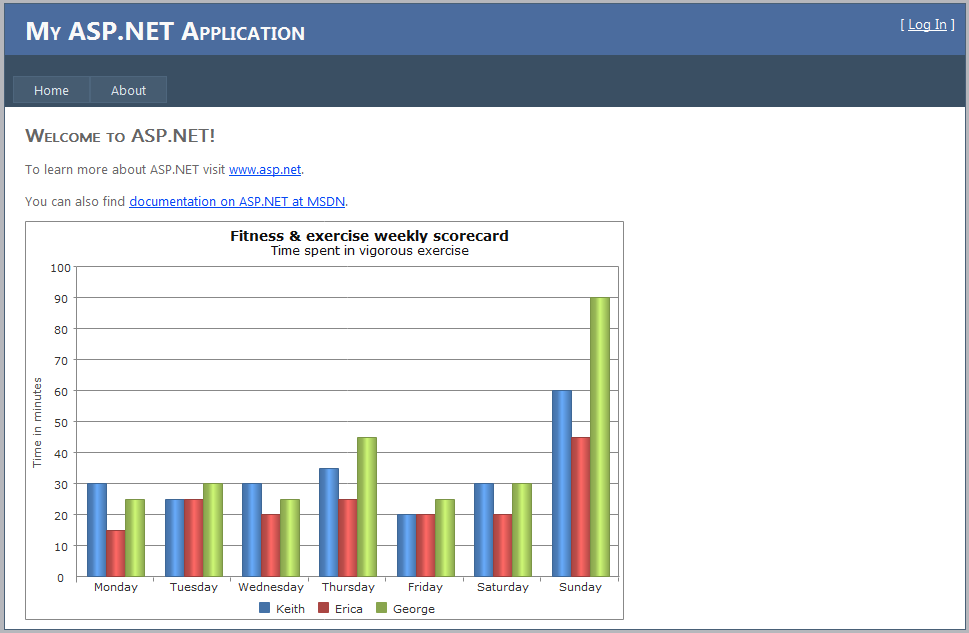
- Add the sample-data.txt file to the App_Data folder. Below is the data, that we will load into the jqxChart.
[{ "Day":"Monday","Keith":30,"Erica":15, "George":25},{ "Day":"Tuesday","Keith":25,"Erica":25,"George":30},{ "Day":"Wednesday","Keith":30,"Erica":20,"George":25},{ "Day":"Thursday","Keith":35,"Erica":25,"George":45},{ "Day":"Friday","Keith":20,"Erica":20,"George":25},{ "Day":"Saturday","Keith":30,"Erica":20,"George":30},{ "Day":"Sunday","Keith":60,"Erica":45,"George":90}]
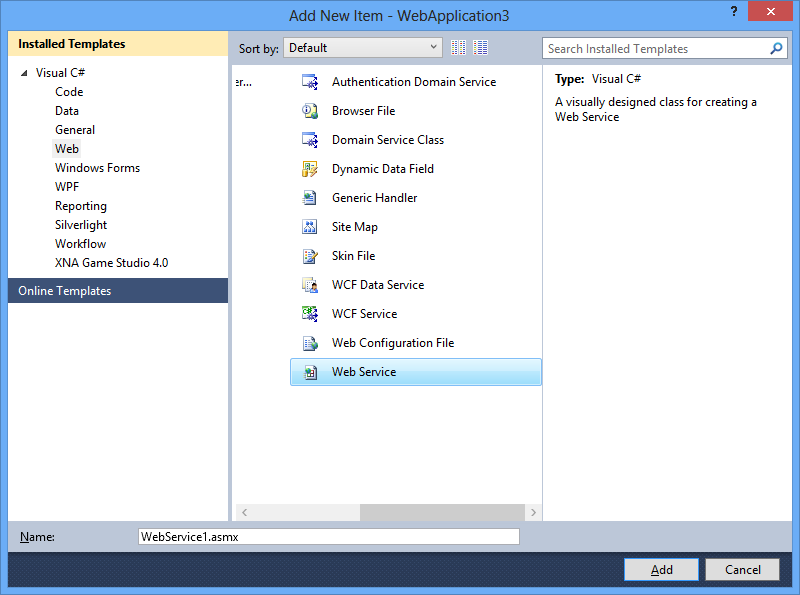
- Add a new web service to the website. Right click on your project’s name. Then choose "Add -> New Item -> Web Service". For example call it "Service".

Double click on the "Service.asmx" to open it. The GetData web method must have ScriptMethod attribute with ResponseFormat.JSON. Below is the web service’s code:
using System;using System.IO;
using System.Net;
using System.Web;
using System.Linq;
using System.Web.Hosting;
using System.Web.Services;
using System.Web.Script.Services;
using System.Collections.Generic;
using System.Web.Script.Serialization;
namespace Chart_WebService
{
///
<summary> /// Summary description for Service
///
</summary> [WebService(Namespace =
"http://tempuri.org/")]
[WebServiceBinding(ConformsTo = WsiProfiles.BasicProfile1_1)]
[System.ComponentModel.ToolboxItem(false)]
[ScriptService]
// To allow this Web Service to be called from script, using ASP.NET AJAX, uncomment the following line.
// [System.Web.Script.Services.ScriptService]
public class Service : System.Web.Services.WebService
{
[WebMethod]
[ScriptMethod(UseHttpGet = true, ResponseFormat = ResponseFormat.Json)]
public string GetData()
{
string result;
WebResponse response;
WebRequest request = HttpWebRequest.Create(Path.Combine(HostingEnvironment.ApplicationPhysicalPath,
"App_Data", "sample-data.txt"));
response = request.GetResponse();
using (var reader = new StreamReader(response.GetResponseStream()))
{
result = reader.ReadToEnd();
- Open the "Default.aspx" page. Include the JavaScript and CSS files to the header section of the page. After that, initialize the web service’s url and the source object. Next, make asynchronous ajax request to the service’s URL. An interesting moment is the implementation of the success function in the jQuery’s ajax method. In its body, we set the source property to point to data.d. We need to do this because ASP.NET is wrapping the object in the following format { d: response }. Finally, initialize the Chart.
<%@ Page Title=
"Home Page" Language="C#" MasterPageFile="~/Site.master" AutoEventWireup="true" CodeBehind=
"Default.aspx.cs" Inherits="Chart_WebService._Default" %>
<asp:Content ID="HeaderContent" runat="server" ContentPlaceHolderID="HeadContent"></asp:Content><asp:Content ID="BodyContent" runat="server" ContentPlaceHolderID="MainContent"> <h2> Welcome to ASP.NET!
</h2> <p> To learn more about ASP.NET visit
<a href="http://www.asp.net" title="ASP.NET Website">www.asp.net
</a>.
</p> <p> You can also find <a href=
"http://go.microsoft.com/fwlink/?LinkID=152368&clcid=0x409" title=
"MSDN ASP.NET Docs">documentation on ASP.NET at MSDN
</a>.
</p><link href="Styles/jqx.base.css" rel="stylesheet" type="text/css" /><link href="Styles/jqx.classic.css" rel="stylesheet" type="text/css" /><script src="Scripts/jquery-1.11.1.min.js" type="text/javascript"></script><script src="Scripts/jqxcore.js" type="text/javascript"></script><script src="Scripts/jqxdata.js" type="text/javascript"></script><script src="Scripts/jqxchart.js" type="text/javascript"></script><script type="text/javascript"> $(document).ready(function () {
var source = {};
$.ajax({
type:
'GET',
dataType:
'json',
async: false,
url:
'http://localhost:1213/Service.asmx/GetData',
cache: false,
contentType:
'application/json; charset=utf-8',
success: function (data) {
source = $.parseJSON(data.d);
},
error: function (err) {
alert(
'Error');
}
});
// prepare jqxChart settings
var settings = {
title:
"Fitness & exercise weekly scorecard",
description:
"Time spent in vigorous exercise",
showLegend: true,
padding: { left: 5, top: 5, right: 5, bottom: 5 },
titlePadding: { left: 90, top: 0, right: 0, bottom: 10 },
source: source,
categoryAxis:
{
dataField:
'Day',
showGridLines: true
},
colorScheme:
'scheme01',
seriesGroups:
[
{
type:
'column',
columnsGapPercent: 50,
seriesGapPercent: 0,
valueAxis:
{
unitInterval: 10,
minValue: 0,
maxValue: 100,
displayValueAxis: true,
description:
'Time in minutes',
axisSize:
'auto',
tickMarksColor:
'#888888' },
series: [
{ dataField:
'Keith', displayText: 'Keith' },
{ dataField:
'Erica', displayText: 'Erica' },
{ dataField:
'George', displayText: 'George' }
]
}
]
};
$(
'#jqxChart').jqxChart(settings);
});
</script><div id="jqxChart" style="width: 600px; height: 400px;"></div>


