In the ever-evolving landscape of web development, the integration of artificial intelligence (AI) into user interface components can significantly enhance the user experience and provide powerful new functionalities. One such combination is using jQWidgets’ jqxGrid, a highly flexible and feature-rich data grid, with AI capabilities. This blog post will guide you through the steps to integrate AI with jqxGrid, enabling smarter data handling and improved user interactions.
What is jqxGrid?
jqxGrid is a feature-rich JavaScript data grid component provided by jQWidgets. It offers a wide range of functionalities, including sorting, filtering, paging, and editing, making it a powerful tool for displaying and manipulating tabular data. With its robust API and customizable options, jqxGrid is a popular choice for web developers looking to create dynamic and interactive data tables.
Why Integrate AI with jqxGrid?
Integrating AI with jqxGrid can bring several advantages:
Enhanced Data Analysis: AI can provide deeper insights into the data displayed in the grid, identifying trends, anomalies, and patterns that may not be immediately apparent.
Predictive Analytics: AI models can predict future trends based on historical data, helping users make informed decisions.
Automated Data Handling: AI can automate repetitive tasks such as data cleaning, validation, and transformation, saving time and reducing errors.
Personalized User Experience: AI can tailor the grid’s behavior and appearance to individual users’ preferences and usage patterns.
Step-by-Step Guide to Integrating AI with jqxGrid
Step 1: Set Up Your Development Environment
First, ensure you have a working development environment with jqxGrid installed. You can include jqxGrid in your project by adding the following script and CSS references:
<link rel="stylesheet" href="https://jqwidgets.com/public/jqwidgets/styles/jqx.base.css" type="text/css" />
<script type="text/javascript" src="https://jqwidgets.com/public/jqwidgets/jqx-all.js"></script>
Step 2: Create a Basic jqxGrid
Set up a basic jqxGrid to display your data. Here’s an example of initializing a jqxGrid with some sample data:
<div id="jqxgrid"></div>

<script type="text/javascript">
    $(document).ready(function () {
        var data = [
            { "Name": "John", "Age": 25, "Country": "USA" },
            { "Name": "Anna", "Age": 30, "Country": "UK" },
            // Add more data as needed
        ];

        var source = {
            localdata: data,
            datatype: "array",
            datafields: [
                { name: 'Name', type: 'string' },
                { name: 'Age', type: 'number' },
                { name: 'Country', type: 'string' }
            ]
        };

        var dataAdapter = new $.jqx.dataAdapter(source);

        $("#jqxgrid").jqxGrid({
            width: 600,
            source: dataAdapter,
            columns: [
                { text: 'Name', datafield: 'Name', width: 200 },
                { text: 'Age', datafield: 'Age', width: 100 },
                { text: 'Country', datafield: 'Country', width: 300 }
            ]
        });
    });
</script>
Step 3: Integrate AI for Data Analysis
To integrate AI, you can use a machine learning library like TensorFlow.js or an AI service like IBM Watson or Google AI. For this example, we’ll use TensorFlow.js to add a simple AI model that predicts the likelihood of users’ ages falling within a certain range based on their country.
First, include the TensorFlow.js library:
<script src="https://cdn.jsdelivr.net/npm/@tensorflow/tfjs"></script>
Next, define a simple AI model and integrate it with jqxGrid:


<script type="text/javascript">
    $(document).ready(function () {
        var data = [
            { "Name": "John", "Age": 25, "Country": "USA" },
            { "Name": "Anna", "Age": 30, "Country": "UK" },
            // Add more data as needed
        ];

        var source = {
            localdata: data,
            datatype: "array",
            datafields: [
                { name: 'Name', type: 'string' },
                { name: 'Age', type: 'number' },
                { name: 'Country', type: 'string' }
            ]
        };

        var dataAdapter = new $.jqx.dataAdapter(source);

        $("#jqxgrid").jqxGrid({
            width: 600,
            source: dataAdapter,
            columns: [
                { text: 'Name', datafield: 'Name', width: 200 },
                { text: 'Age', datafield: 'Age', width: 100 },
                { text: 'Country', datafield: 'Country', width: 300 },
                {
                    text: 'Age Prediction', datafield: 'AgePrediction', width: 200,
                    cellsrenderer: function (row, columnfield, value, defaulthtml, columnproperties, rowdata) {
                        return '<div style="margin: 4px;">' + predictAge(rowdata.Country) + '</div>';
                    }
                }
            ]
        });

        // Simple AI model to predict age range based on country
        async function predictAge(country) {
            // Load or define your model here
            const model = await tf.loadLayersModel('path/to/model.json');
            const inputTensor = tf.tensor([country]);
            const prediction = model.predict(inputTensor);
            return prediction.dataSync()[0];
        }
    });
</script>
Step 4: Train Your AI Model
Training your AI model depends on your specific use case. For instance, you could use historical data to train a model that predicts user behavior or trends. This step typically involves:
Collecting Data: Gather historical data relevant to your predictions.
Preprocessing Data: Clean and transform the data to make it suitable for training.
Training the Model: Use a machine learning library to train your model.
Deploying the Model: Make the trained model available to your web application.
Step 5: Deploy and Test
After integrating the AI model with jqxGrid, deploy your web application and test the new functionalities. Ensure that the predictions and enhancements provided by the AI are accurate and improve the user experience.
Conclusion
Integrating AI with jQWidgets’ jqxGrid can significantly enhance the capabilities of your data grid, providing deeper insights, predictive analytics, and a more personalized user experience. By following this step-by-step guide, you can create a powerful combination of jqxGrid’s robust data handling features and AI’s advanced analytical capabilities. Experiment with different AI models and data sources to discover the full potential of this integration.
We are thrilled to announce that JQWidgets now fully supports Angular 18, the latest version of Google’s widely-used front-end framework. Seamless Integration
JQWidgets has always prioritized seamless integration with Angular, and the support for Angular 18 is no different. The updated JQWidgets library ensures that all components are fully compatible with Angular 18’s new features and improvements. This means you can take advantage of Angular 18’s latest advancements while leveraging the rich set of JQWidgets components without any compatibility issues.
Enhanced Performance
Angular 18’s performance enhancements, combined with JQWidgets’ lightweight and efficient components, result in a highly performant application. Whether you’re building complex data-driven applications or simple dashboards, the combination of these two powerful tools will ensure a smooth and responsive user experience.
Simplified Development
With Angular 18’s support for standalone components and JQWidgets’ easy-to-use API, developing and managing UI components becomes more straightforward. This simplifies the development process, allowing you to focus more on building features and less on boilerplate code.
Rich Feature Set
JQWidgets offers a rich set of features that complement Angular 18’s capabilities. From advanced data visualization tools to interactive form elements, JQWidgets provides everything you need to create comprehensive and user-friendly interfaces.
The support for Angular 18 in JQWidgets marks a significant milestone in providing developers with the tools they need to create exceptional web applications. With enhanced performance, simplified development, and a rich feature set, the combination of JQWidgets and Angular 18 is sure to elevate your development experience. Update your projects today and take advantage of these powerful tools to build the next generation of web applications.
jQWidgets v19.2.0 Release, May-21-2024
What’s New:
jqxTimeline component. The jqxTimeline displays a collection of events and their data in a chronological succession for each year. The Timeline allows you to render its events in a vertical or horizontal listand you can easily customize it with CSS. Demo: Timeline component
What’s Improved:
Added ‘disablerowdetails’ for jqxGrid which allows you to disable row details for specific grid rows.
What’s Fixed:
Fixed an issue in jqxWindow. The JqxWindow resize() method cannot set the width.
Fixed an issue in jqxGantt. Gantt – some rules in jqx.gantt.css are too general and affect other widgets.
Fixed an issue in jqxScheduler. rowsHeight not applying if set during initialization.
Fixed an issue in jqxScheduler, when the scheduler is in month view and the popup with events is displayed.
Fixed an issue in jqxGrid. exportview with ‘csv’ creates unnecessary spaces.
Fixed an issue in jqxGrid when switching dynamically between single and multiple sort modes.
Fixed an issue in jqxGrid. The column’s validation was not called when deleting the value of a cell.
Fixed an issue in jqxFileUpload. Multiple upload did not work correctly.
Fixed an issue in jqxDockingLayout. The issue was in the “IDE-like Layout” demo.
Fixed an issue in jqxCore. Jqwidgets uses the “unload” event which is deprecated.
Fixed an issue in jqxDataTable. The column groups initialization did not work correctly with pinned columns.
Fixed an issue in jqxDateTimeInput. The input of a date did not work correctly in the full edit mode.
Fixed an issue in jqxSlider about a function called sizeChanged and is undefined.
In the next version of jQWidgets, we will be adding a new Timeline component. A timeline component is a user interface element used to display a chronological sequence of events or activities along a linear axis. It provides users with a visual representation of time-related data, making it easier to understand the order and relationships between different events.
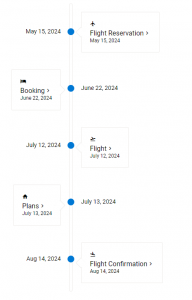
Key features of the timeline component include:
- Chronological Display: Events are displayed in chronological order along a horizontal or vertical axis.
- Interactive Design: Users can interact with the timeline by scrolling, zooming, or clicking on individual events for more information.
- Customizable Styling: The appearance of the timeline, including colors, fonts, and layout, can often be customized to match the design of the application.
- Support for Rich Content: Any HTML content can be added to the Timeline component. For example it may be including text, images, videos, and links.
- Responsiveness: Adapts to different screen sizes and devices, ensuring a consistent user experience across platforms.
Timeline components are commonly used in a variety of applications, including project management tools, historical websites, educational platforms, and personal storytelling apps. They provide a visually engaging way to present time-related information, making it easier for users to understand and navigate complex chronological data.
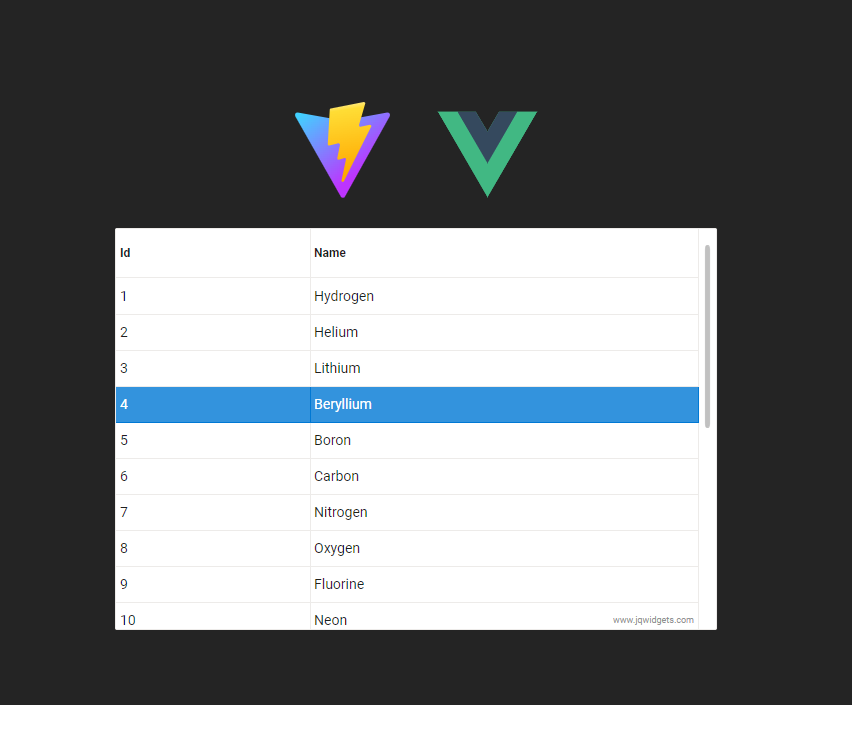
Vue Vite with jQWidgets
This tutorial will show you how to use Vite along with the Vue Components by jQWidgets.
Please, follow the instructions below:
npm create vite@latest
Then choose a project name eg. “my project”, choose Vue as a framework. Navigate to the project you just created.
cd my-project

npm install
npm install jqwidgets-scripts
npm run dev
Now open components/HelloWorld.vue and replace it with <template>
<div>
<JqxGrid :theme="'fluent'" :source="source" :columns="columns" :columngroups="columnGroups"></JqxGrid>
</div>
</template>
<script>
import { ref, onMounted } from 'vue'
import JqxGrid from 'jqwidgets-scripts/jqwidgets-vue3/vue_jqxgrid.vue';
export default {
components: {
JqxGrid
},
setup(props, context) {
const columns = [
{text: 'Id', datafield: 'id', columngroup: 'Details'},
{text: 'Name', datafield: 'name', columngroup: 'Details'}
];
const source = [
{id: 1, name: 'Hydrogen'},
{id: 2, name: 'Helium'},
{id: 3, name: 'Lithium'},
{id: 4, name: 'Beryllium'},
{id: 5, name: 'Boron'},
{id: 6, name: 'Carbon'},
{id: 7, name: 'Nitrogen'},
{id: 8, name: 'Oxygen'},
{id: 9, name: 'Fluorine'},
{id: 10, name: 'Neon'},
{id: 11, name: 'Sodium'},
{id: 12, name: 'Magnesium'},
{id: 13, name: 'Aluminum'},
{id: 14, name: 'Silicon'},
{id: 15, name: 'Phosphorus'},
{id: 16, name: 'Sulfur'},
{id: 17, name: 'Chlorine'},
{id: 18, name: 'Argon'},
{id: 19, name: 'Potassium'},
{id: 20, name: 'Calcium'}
];
const columnGroups = [
{ text: 'Details', align: 'center', name: 'Details' }
]
onMounted(() => {
});
return {
columnGroups,
source,
columns
}
}
}
</script>
<style scoped>
</style>
After that, open the index.html file and add a reference to our theme files.
<link rel="stylesheet" href="node_modules/jqwidgets-scripts/jqwidgets/styles/jqx.base.css" type="text/css" />
<link rel="stylesheet" href="node_modules/jqwidgets-scripts/jqwidgets/styles/jqx.fluent.css" type="text/css" />
The result is:
Posted in:
Grid, VUE, VUEJS
Tagged:
jqxGrid, vite, vue3
We are thrilled to announce the latest release of jQWidgets. The highlight of this release is the introduction of Sparklines support within jqxGrid. Sparklines are miniature charts that provide a quick, simple representation of data trends, allowing users to gain insights at a glance. With this new feature seamlessly integrated into jqxGrid, developers can now effortlessly incorporate Sparklines directly into their datagrids enriching the data presentation and enhancing usability.
In addition to Sparklines support, this update introduces a built-in context menu feature to jqxGrid. Context menus provide users with context-specific options, enabling them to perform actions relevant to the selected data or grid area with ease. By integrating a context menu directly into jqxGrid, developers can streamline user interactions and offer a more intuitive and efficient user experience.


Key features of the latest release include:
What’s New:
jqxGrid Sparklines Support: Integrate miniature charts directly into jqxGrid for enhanced data visualization and trend analysis.
jqxGrid Built-in Context Menu: Provide users with context-specific options within jqxGrid, streamlining user interactions and improving usability.
What’s Improved:
Added ‘blur’ method to jqxNumberInput.
Added ‘filterAppointments’ method to jqxScheduler.
What’s Fixed:
Fixed an issue in jqxPopover. Popover was not closing, if a button is clicked.
Fixed an issue in jqxCheckboxGroup and jqxRadioButtonGroup. An error occurs when the ‘disabled’ attribute is set to true. Doesn’t happen if the “disable” method is used.
Fixed an issue in jqxCheckboxGroup and jqxRadioButtonGroup. If the ‘change’ attribute is not specified, values cannot be retrieved using the ‘val’ or ‘getValue’ method.
Fixed an issue in jqxCheckboxGroup and jqxRadioButtonGroup. Setting values in disabled state doesn’t trigger the ‘change’ attribute. This can be verified by clicking “Disable” and “Set Items”.
Fixed an issue in jqxDropDownList. The ‘change’ event doesn’t work when using keyboard to select an item.
Fixed an issue in jqxKanban. ‘updateItem’ of an item when passing empty tags does not work.
Fixed an issue in jqxEditor. When the editor is displayed in a window, the color pickers are displayd below the window.
Fixed an issue in jqxSplitLayout for Angular. The component did not render in Angular 17.
Fixed an issue in jqxTextArea. The ‘theme’ property cannot be changed dynamically.
Fixed an issue in jqxMaskedInput. The ‘CapsLock’ did not work.
Fixed an issue in jqxNumberInput. Can’t enter decimal point on mobile devices.
Fixed an issue in jqxRating with the Fluent theme.
Fixed an issue in jqxGrid. Column reorder duplicates column over another when we drop over a checkbox column.
Fixed an issue in jqxGrid. When the Grid is localized, the filter row list filter was not working correctly.
Fixed an issue in jqxGrid. ‘getselectedcells’ method sometimes returns wrong result.
Fixed an issue in jqxGrid. Grouping rows appear empty if there is only one visible column.
Fixed an issue in jqxGrid. jqxGrid sometimes displays unnecessary scrollbar.
Fixed an issue in jqxGrid. Applying state to a grouped grid sometimes reorders the columns incorrectly.
Fixed an issue in jqxGrid. Incorrect column calculation when some columns are with ‘px’ and others are with ‘percentage’.
Fixed an issue in jqxGrid. ‘columnresize’ property cannot be changed dynamically.
Fixed an issue in jqxGrid. ‘getgroup’ does not return the ‘expanded’ state of the group.
Fixed an issue in jqxGrid. Group aggregates are not updated after editing a cell.
Fixed an issue in jqxGrid. When ‘sortmode’ is ‘many’, the savestate does not save all sort options.
Fixed an issue in jqxGrid. ‘savestate’ always saves column widths in pixels instead of the original value.
Existing users can easily upgrade to the latest version of jQWidgets to access these new features and enhancements. For new users, now is the perfect time to experience the power and versatility of jQWidgets in creating robust web applications
jqwidgets-ng NPM package is updated with SSR support for Angular 17.
Smart UI v18.0.0 Release, Jan-24-2024
What’s New:
- Grid Card view layout.
- Grid Computed columns with Formulas.
- Grid Column Editor with custom data source.
What’s Improved:
- Grid Performance. The scrolling, data updates and mobile UX.
- Dropdownlist, ComboBox, Menus and other dropdowns UX animations & effects.
- Gantt day view now allows you to display hour, half hour and quarter slots.
What’s Fixed:
- Fixed an issue in the Grid about column reorder in column groups.
- Fixed an issue in the Grid about autoHideGroupColumn option.
- Fixed an issue in the Grid related to the prepared sql queries.
- Fixed an issue in the Grid related to the dropdown when the Grid is inside a Window.
- Fixed an issue in the Grid related to the Filter row when Ctrl+A is used.
- Fixed an issue in the Grid related to the localization of the Data Exported currencies.
- Fixed an issue in the Grid related to the column reorder & toolbar rendering after removing the Grid from the DOM and them adding it again.
- Fixed an issue in the DockingLayout related to the state maitenance.
- Fixed an issue in the DockingLayout related to the dragging of text and images in a layout panel.
- Fixed an issue in the Gantt issue related to the rendering in Month view when monthScale = ‘day’.
- Fixed an issue in the Gantt issue related to the firstDayOfWeek property.
- Fixed an issue in the Gantt dayScale which allows you to display hour, half hour and quarter in the Gantt’s day view.
- Fixed an issue in the Gantt about task base line rendering in month and year views.
- Fixed an issue in the Scheduler issue is fixed related to the Timeline Month view when Event is resized.
Posted in:
ANGULAR, Chart, Grid, html elements, JavaScript, JavaScript Plugins, JavaScript UI, JavaScript UI Plugins, JavaScript UI Widgets, JavaScript Widgets, jQuery, jQuery Plugins, jQuery UI, jQuery UI Plugins, jQuery UI Widgets, jQuery Widgets, PHP, Pivot Grid, React, react grid, React Javascript Library, REACTJS, typescript, VUE, VUEJS
The new release brings the following updates:
- Grid Card view layout.
- Grid Formulas support.
- Grid Performance boost.
- Grid mobile experience was improved.
- Grid optimizations about groups render.
- Grid issue is fixed about column reorder in column groups.
- Grid issue is fixed about autoHideGroupColumn option.
- Grid issue is fixed related to the prepared sql queries.
- Grid issue is fixed related to the dropdown when the Grid is inside a Window.
- Grid issue is fixed related to the Filter row when Ctrl+A is used.
- Grid issue is fixed related to the localization of the Data Exported currencies.
- DockingLayout issue is fixed related to the state maitenance
- DockingLayout issue is fixed related to the dragging of text and images in a layout panel.
- Grid new autoWidth and autoHeight layout properties.
- Gantt issue is fixed related to the rendering in Month view when monthScale = ‘day’.
- Gantt issue is fixed related to the firstDayOfWeek property.
- Gantt dayScale which allows you to display hour, half hour and quarter in the Gantt’s day view.
- Scheduler issue is fixed related to the Timeline Month view when Event is resized.
- Improved UX for Dropdownlist, ComboBox, Menus and other dropdowns. They were updated with new smooth animations.
Become one of the first 500 early adopters on Artavolo. With Artavolo, you can manage your work online without any technical expertise.
Gain exclusive access to the platform for FREE.
|
|