jQWidgets Forums
Forum Replies Created
-
Author
-
April 19, 2016 at 9:01 pm in reply to: nothing displays on this chart nothing displays on this chart #83669
well I got this to work. I’m not sure what I did to make it work though.
<!DOCTYPE html>
<html lang="en">
<head>
    <title>Culture Summary by Submission</title>
	  <meta name="description" content="Culture Summary by Submission">

    <link rel="stylesheet" href="../jqx/styles/jqx.base.css" type="text/css" />
    <link rel="stylesheet" href="../css/culture3.css" type="text/css" />

	  <script src="http://ajax.googleapis.com/ajax/libs/jquery/1/jquery.min.js"></script>
    <script src="../jqx/jqxcore.js"></script>
    <script src="../jqx/jqxdata.js"></script>
    <script src="../jqx/jqxdraw.js"></script>
    <script src="../jqx/jqxchart.core.js"></script>

    <script>
        $(document).ready(function () {
            // prepare chart data as an array
            var chartData = [
                    { week: 'wk1', 'No Growth': 30, '1-10': 0, '11-100': 25 },
                    { week: 'wk2', 'No Growth': 25, '1-10': 25, '11-100': 0 },
                    { week: 'wk3', 'No Growth': 30, '1-10': 0, '11-100': 25 },
                    { week: 'wk4', 'No Growth': 35, '1-10': 25, '11-100': 45 },
                    { week: 'wk5', 'No Growth': 0, '1-10': 20, '11-100': 25 },
                    { week: 'wk6', 'No Growth': 30, '1-10': 0, '11-100': 30 }
                ];
            // prepare jqxChart settings
            var settings = {
                title: "//clientSpan",
                description: "//dateSpan",
                enableAnimations: true,
                showLegend: true,
                legendLayout : { left: 750, top: 10, width: 500, height: 200, flow: 'vertical' },
                padding: { left: 5, top: 5, right: 5, bottom: 5 },
                titlePadding: { left: 90, top: 0, right: 0, bottom: 10 },
                source: chartData,
                xAxis:
                {
                    dataField: 'week',
                    tickMarks: {
                        visible: true,
                        interval: 1,
                        color: '#BCBCBC'
                    },
                    gridLines: {
                        visible: true,
                        interval: 1,
                        color: '#BCBCBC'
                    },
                    axisSize: 'auto'
                },
                valueAxis:
                {
                    unitInterval: 10,
                    title: {text: 'Number of Samples'},
                    tickMarks: {color: '#BCBCBC'},
                    gridLines: {color: '#BCBCBC'},
                    labels: {
                        horizontalAlignment: 'right'
                    },
                },
                colorScheme: 'scheme04',
                seriesGroups:
                    [
                        {
                            type: 'stackedcolumn',
                            columnsGapPercent: 100,
                            seriesGapPercent: 5,
                            series: [
                                    { dataField: 'No Growth', displayText: 'No Growth' },
                                    { dataField: '1-10', displayText: '1-10' },
                                    { dataField: '11-100', displayText: '11-100' },
                                    { dataField: '100-1001', displayText: '100-1001' },
                                    { dataField: '1001-10000', displayText: '1001-10000' },
                                    { dataField: 'TNTC', displayText: 'TNTC' }
                                ]
                        }
                    ]
            };
            // setup the chart
            $('#chartContainer').jqxChart(settings);

				    // add a new color scheme named 'kuster'
				    $('#chartContainer').jqxChart('addColorScheme', 'kuster', ['#00C000', '#80FF80', '#FFFF40','#F8902C', '#FF8080', '#FF0000']);
				    // apply the new scheme by setting the chart's colorScheme property
				    $('#chartContainer').jqxChart('colorScheme', 'kuster');
				    // refresh the chart
				    $('#chartContainer').jqxChart('refresh');
        });
    </script>
</head>
<body>
	<div id="wrapper">

			<div id="header" >
				<!-- insert company  header -->
			</div>

			<div id="chartContainer" style="width:850px; height:500px;">
			</div>

			<div class='noPrint' id='bPrint'>
			<button style='font-size:8pt' onclick="printThis();">print this page</button><br>
			For your protection, this link will expire in 7 days.
			</div>

	</div>
</body>
</html>
April 19, 2016 at 8:20 pm in reply to: nothing displays on this chart nothing displays on this chart #83665I’ve made some changes, but still no chart
<!doctype html>
<html lang="en">
<head>
	<meta charset="utf-8">
	<title>Culture Summary</title>
	<meta name="description" content="Culture Summary">
	<meta name="author" content="Shawn Anderson">

	<script src="http://ajax.googleapis.com/ajax/libs/jquery/1/jquery.min.js"></script>

	<link rel="stylesheet" href="../jqx/styles/jqx.base.css" type="text/css" />
	<link rel="stylesheet" href="../css/culture3.css?v=1.0">

</head>
<body>

	<div id="wrapper">

			<div id="header" >
				<!-- insert company  header -->
			</div>

			<div id="graphWrapper">

			</div>


			<div class='noPrint' id='bPrint'>
			<button style='font-size:8pt' onclick="printThis();">print this page</button><br>
			For your protection, this link will expire in 7 days.
			</div>

	</div>

<script src="../jqx/jqxcore.js"></script>
<script src="../jqx/jqxdraw.js"></script>
<script src="../jqx/jqxchart.core.js"></script>
<script src="../jqx/jqxdata.js"></script>


<script>
	// print page function
	function printThis(){


	};

	$(document).ready(function () {
            // prepare chart data as an array
            var chartData = [
                    { week: 'wk1', 'No Growth': 30, '1-10': 0, '11-100': 25 },
                    { week: 'wk2', 'No Growth': 25, '1-10': 25, '11-100': 0 },
                    { week: 'wk3', 'No Growth': 30, '1-10': 0, '11-100': 25 },
                    { week: 'wk4', 'No Growth': 35, '1-10': 25, '11-100': 45 },
                    { week: 'wk5', 'No Growth': 0, '1-10': 20, '11-100': 25 },
                    { week: 'wk6', 'No Growth': 30, '1-10': 0, '11-100': 30 }
                ];
            // prepare jqxChart settings
            var settings = {
                title: "//clientSpan",
                description: "Culture Summary by Submission",
                enableAnimations: true,
                showLegend: true,
                padding: { left: 5, top: 5, right: 5, bottom: 5 },
                titlePadding: { left: 90, top: 0, right: 0, bottom: 10 },
                source: chartData,
                xAxis:
                {
                    dataField: 'week',
                    tickMarks: {
                        visible: true,
                        interval: 1,
                        color: '#BCBCBC'
                    },
                    gridLines: {
                        visible: true,
                        interval: 1,
                        color: '#BCBCBC'
                    },
                    axisSize: 'auto'
                },
                valueAxis:
                {
                    unitInterval: 1,
                    title: {text: 'Number of Samples'},
                    tickMarks: {color: '#BCBCBC'},
                    gridLines: {color: '#BCBCBC'},
                    labels: {
                        horizontalAlignment: 'right'
                    },
                },
                colorScheme: 'scheme04',
                seriesGroups:
                    [
                        {
                            type: 'stackedcolumn100',
                            columnsGapPercent: 100,
                            seriesGapPercent: 5,
                            series: [
                                    { dataField: 'No Growth', displayText: 'No Growth' },
                                    { dataField: '1-10', displayText: '1-10' },
                                    { dataField: '11-100', displayText: '11-100' }
                                ]
                        }
                    ]
            };
            // setup the chart
            $('#graphWrapper').jqxChart(settings);
        });
  </script>

</body>
</html>
April 7, 2016 at 5:15 pm in reply to: jqxWindow is only modal on first execution jqxWindow is only modal on first execution #83269I got it figured out.
I was calling the init function every time I wanted to see the jqxWindow.
What I needed to do was init the jqxWindow once, then call the open and close methods to use it.thanks for your help
March 25, 2016 at 6:52 pm in reply to: make cell editable depending on value of another cell in the same row make cell editable depending on value of another cell in the same row #82855one other thing I’d like to do: If the value of the cell ‘linkORfile’ changes, I want to change the editable state of ‘linkHref’ as well.
How?
March 15, 2016 at 3:10 pm in reply to: can't always click checkbox can't always click checkbox #82492I updated to the latest version and that fixed the problem.
ThanksMarch 14, 2016 at 7:28 pm in reply to: can't always click checkbox can't always click checkbox #82451February 3, 2016 at 10:22 pm in reply to: nothing displays on scatter chart nothing displays on scatter chart #81092I see the problem.
I had no style for size set to the #chartContainerwell, I got it to work by preparing the data in this way
var source = { datatype: "json", datafields: [ { name: 'uName', type: 'string' }, { name: 'rqDate', type: 'string' }, { name: 'ipAddr', type: 'string' }, { name: 'programName', type: 'string' } ], root: "aMatch", url: url };also, I am initializing like this:
            $("#jqxgrid").jqxGrid(
            {
                width: 800,
                source: dataAdapter,
                pageable: true,
                autoheight: true,
                sortable: true,
                altrows: true,
                enabletooltips: true,
                editable: true,
                selectionmode: 'multiplecellsadvanced',
                columns: [
                  { text: 'User',datafield:'uName'},
                  { text: 'Request Date',datafield:'rqDate' },
                  { text: 'IP Address',datafield:'ipAddr'},
                  { text: 'Program Name',datafield:'programName'}
                ]
            });
July 27, 2015 at 10:53 pm in reply to: drawing lines on scatter chart drawing lines on scatter chart #74193perfect, thank you
July 23, 2015 at 7:24 pm in reply to: drawing lines on scatter chart drawing lines on scatter chart #74104I’d like to add that the lines are a percentage above or below the baseline.
So, say I set my baseline in this chart to $225,000.
Green lines would show +/- 10% beyond the baseline.
Red lines would we be 20% +/-.I’m wondering if the “draw” functions are what I need.
July 22, 2015 at 3:30 pm in reply to: x-axis labels, other json data x-axis labels, other json data #74058that was it! I changed “stacked line” to “line” and it’s perfect.
Thanks again!July 22, 2015 at 3:28 pm in reply to: x-axis labels, other json data x-axis labels, other json data #74057… I see that it is adding the values together, so I suspect I’m using the wrong type of chart.
July 22, 2015 at 3:27 pm in reply to: x-axis labels, other json data x-axis labels, other json data #74056thank looks much better! Thank you.
I have one more question.
The plotted points on the chart do not seem to correspond to the data values from the json.
For instance, the “count” from the data is 25, but it is plotted at 36.
What am I doing wrong? thanks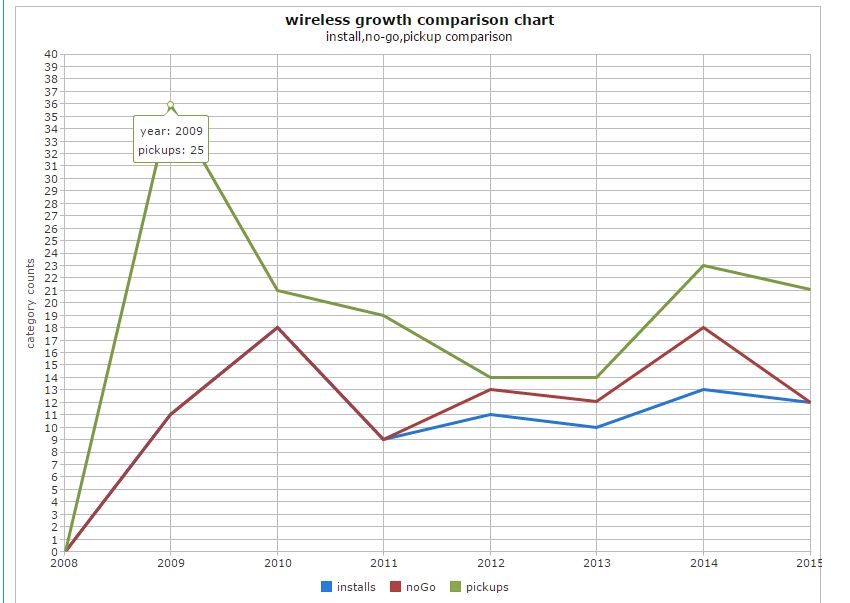
thank you
-
AuthorPosts