jQWidgets Forums
Forum Replies Created
-
Author
-
February 27, 2013 at 6:38 pm in reply to: How use the click events on line type How use the click events on line type #15971
I solved it by doing this:
1- Created two vars to store the selected x and it’s value.
2- Created a function for the mouseover event in “seriesGroups” like this:onChartMouseOver = function (evt) { lastElementIndex = evt.elementIndex; lastElementValue = evt.elementValue; },3- Created a function for the click event of the whole component (which is triggered when the user clicks in any part of the chart, so it requires validation). From there I used the lastElementIndex and lastElementValue previously updated with the last mouseover event.
Hope it helps you.
February 26, 2013 at 3:03 pm in reply to: How use the click events on line type How use the click events on line type #15889Son la cara
February 21, 2013 at 8:21 pm in reply to: Browser crashes when creating chart Browser crashes when creating chart #15645Found why it crashed. I was using 0 in tickMarksInterval, unitInterval and gridLinesInterval.
February 8, 2013 at 6:26 pm in reply to: Browser crashes when creating chart Browser crashes when creating chart #14922At least can you take a look at the settings of my first post? It’s about the settings I use to create the chart on a div element. Perhaps the problem has to do with the dates, becouse on the samples there’s only one register per day while I’m using one register per minute (more or less).
February 7, 2013 at 6:41 pm in reply to: Browser crashes when creating chart Browser crashes when creating chart #14866I’m using knockout in this project. The chartDataSource is created this way:
crearChartDataSource = function (reportePorMovil) { var chartDataSource = []; for (var i = 0; i < reportePorMovil().length; i++) { var registro = reportePorMovil()[i]; chartDataSource.push({ Date: new Date(registro.fechaGPS()), Velocidad: registro.velocidad() }); } return { datatype: 'array', datafields: [{ name: 'Date', type: 'date' }, { name: 'Velocidad', type: 'float' }], localdata:chartDataSource }; },The html I use is:
<div style="width:680px; height:400px; vertical-align: top; display: inline-block; padding: 10px;" data-bind="jqxChart: chartDataSource, chartOptions: { source: chartDataSource, title: i18n.t('velocidad'), description: nombreMovil, padding: { left: 10, top: 5, right: 10, bottom: 5 }, titlePadding: { left: 90, top: 0, right: 0, bottom: 10 }, colorScheme: 'scheme04', categoryAxis: { dataField: 'Date', formatFunction: chartFormatFunction, toolTipFormatFunction: chartToolTipFormatFunction, type: 'date', baseUnit: 'date', showTickMarks: true, tickMarksInterval: 0, tickMarksColor: '#888888', unitInterval: 0, showGridLines: true, gridLinesInterval: 0, gridLinesColor: '#888888', axisSize: 'auto', valuesOnTicks: false, verticalTextAlignment: true, minValue: fechaDesde, maxValue: fechaHasta }, seriesGroups: [ { type: 'line', valueAxis: { unitInterval: 500, minValue: reporteFilter.velocidadDesdeNumber(), maxValue: reporteFilter.velocidadHastaNumber(), displayValueAxis: true, description: 'Km/H', axisSize: 'auto', tickMarksColor: '#888888' }, series: [ { dataField: 'Velocidad', displayText: nombreMovil } ] } ] } "></div>
Each of the parameters in data-bind are binded this way:
ko.bindingHandlers.jqxChart = { init: function (element, valueAccessor, allBindingsAccessor) { var binding = ko.utils.unwrapObservable(allBindingsAccessor()); //initialize jqxTabs with some optional options var options = binding.chartOptions || {}; var theme = ''; var dataInfo; if (!!options.sourceUrl) { var source = { datatype: options.sourceUrl.datatype, datafields: options.sourceUrl.datafields, url: options.sourceUrl.url }; dataInfo = new $.jqx.dataAdapter(source, { async: false, autoBind: true, loadError: function(xhr, status, error) { alert('Error loading "' + source.url + '" : ' + error); } }); }else { var source = { datatype: options.source.datatype, datafields: options.source.datafields, localdata: options.source.localdata }; dataInfo = new $.jqx.dataAdapter(source, { async: false, autoBind: true, loadError: function (xhr, status, error) { alert('Error loading "' + source.url + '" : ' + error); } }); } var settings = { title: options.title, description: options.description, enableAnimations: options.enableAnimations || true, showLegend: options.showLegend || true, padding: options.padding || { left: 10, top: 5, right: 10, bottom: 5 }, titlePadding: options.titlePadding || { left: 90, top: 0, right: 0, bottom: 10 }, source: dataInfo, categoryAxis: options.categoryAxis, colorScheme: options.colorScheme, seriesGroups: options.seriesGroups }; $(element).jqxChart(settings); } };Finally: I’m running this on chrome Version 24.0.1312.52 m and Firefox 18.0.2 with JQuery v1.7.2
Is there anything for .net?
Thank you for your quick answer Peter. About the first case, can you think of any alternative solution? Here’s an image of how it looks like:
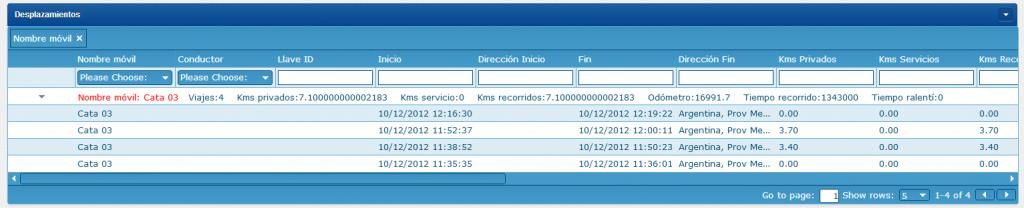
As you can see, the group has a lot of fields, and there are many more that aren’t shown. The best solution would be that it behaves as a normal row and not show it’s fields as a long string but as columns, but I guess I can’t do something like that. Can you think of any alternative solution? I would really apreciate that.
About the second case, thanks for the suggestion, it was very helpful.
By the way, is there any page where I can see which are all the parameters that may recibe the function properties such as groupsrenderer?
-
AuthorPosts