Imagine the following datasource :
[
{serieId: ‘serie1’, displayText: ‘First serie’, min: 2, avg: 22, max: 50, median: 20, percentile25: 15, percentile75: 25 },
{serieId: ‘serie2’, displayText: ‘Second serie’, min: 10, max: 100, avg: 12, median: 15, percentile25: 8, percentile75: 17},
…
]
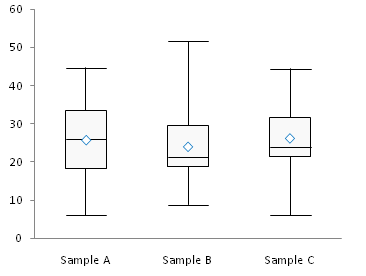
Could I use candlestick to display one candle for each serie (with low is min, high is max, open is percentile25 and high is percentile75) ?
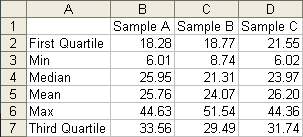
Something like http://peltiertech.com/images/2009-09/simple07box06.png for the data like http://peltiertech.com/images/2009-09/SimpleBoxData.png
I tried to adapt the provided example on candlestick but I do not manage to make it work without a time serie…
I also tried to create a jseditor but I do not manage to reproduce the basic example : https://www.jseditor.io/?key=testcandlestickserie
Thanks for any pointers