Create a new ASP.NET MVC 3 project and choose the "Empty project" option for template. For "View engine" select "Razor". 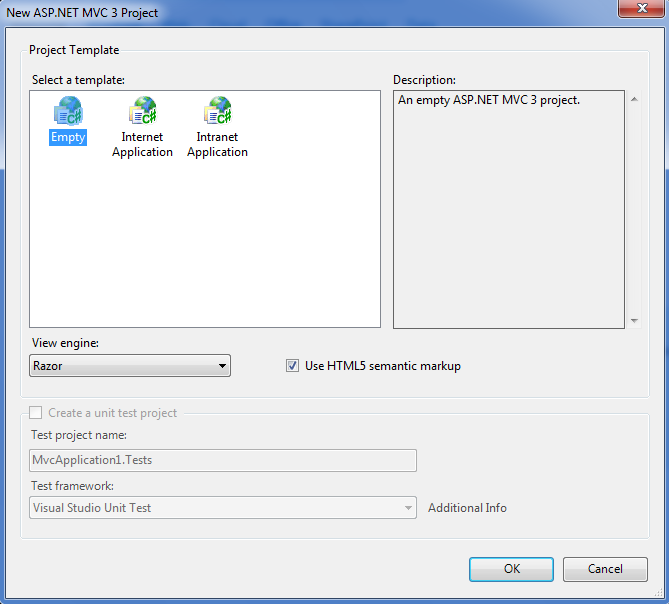
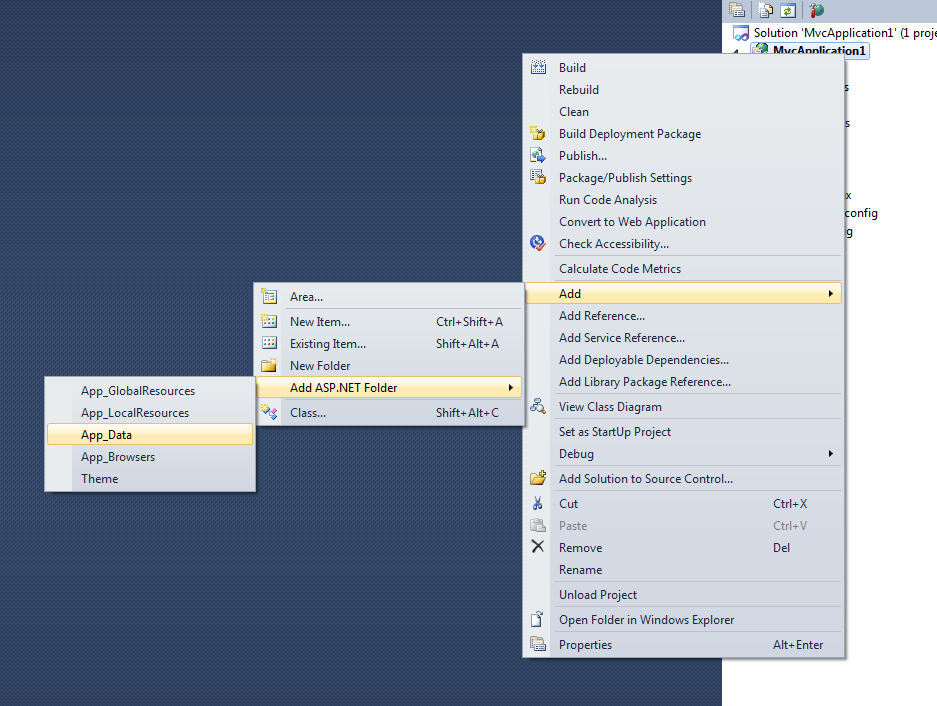
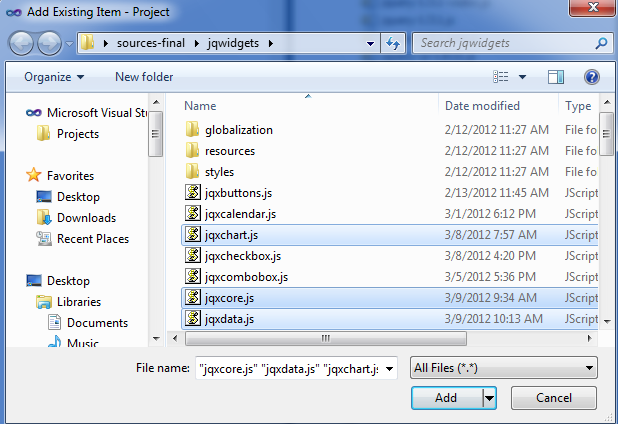 In the opened dialog select the following JavaScript files: "jquery-1.11.1.min.js, jqxdata.js, jqxcore.js, jqxchart.js" from your jqwidgets folder.
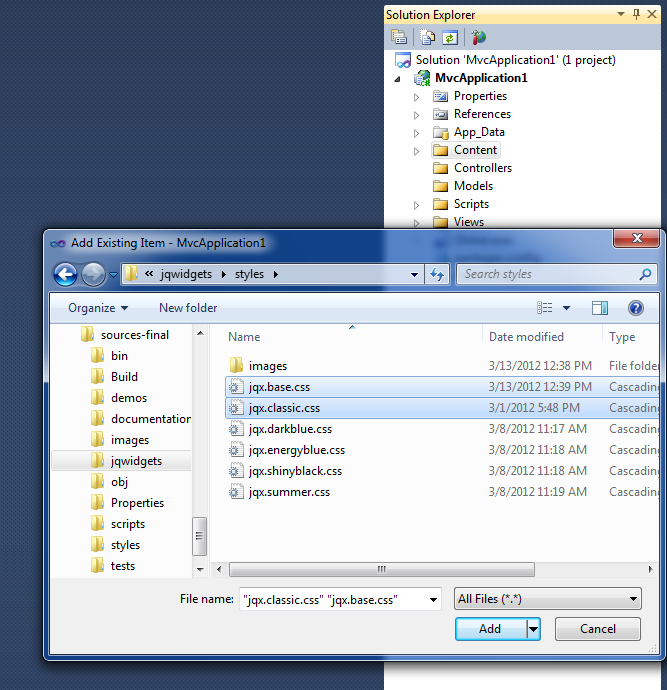
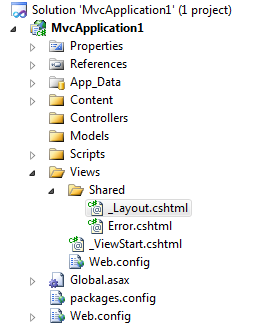 After finishing the last step your "_Layout.cshtml" should look like this:
<!DOCTYPE html><html><head><meta charset="utf-8" /><title>@ViewBag.Title</title><link href="@Url.Content("~/Content/Site.css")" rel="stylesheet" type="text/css" /><link href="@Url.Content("~/Content/jqx.base.css")" rel="stylesheet" type="text/css" /><link href="@Url.Content("~/Content/jqx.classic.css")" rel="stylesheet" type="text/css" /><script src="@Url.Content("~/Scripts/jquery-1.11.1.min.js")" type="text/javascript"></script><script src="@Url.Content("~/Scripts/jqxcore.js")" type="text/javascript"></script><script src="@Url.Content("~/Scripts/jqxdata.js")" type="text/javascript"></script><script src="@Url.Content("~/Scripts/jqxchart.js")" type="text/javascript"></script></head><body>@RenderBody()</body></html>
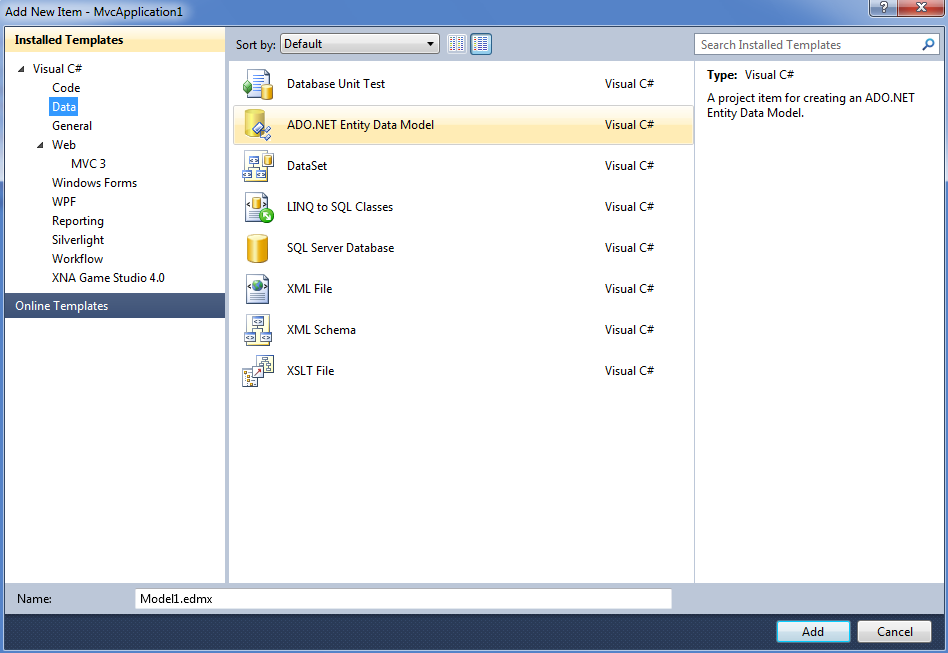 In the "Choose Model Contents" section select "Generate from database" and click Next.
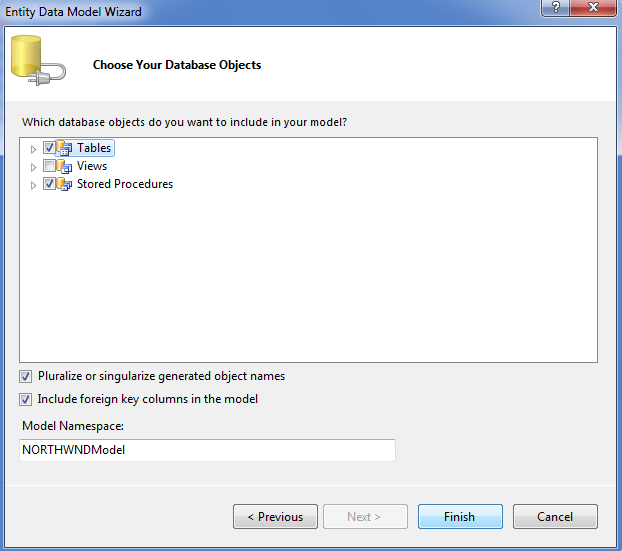
 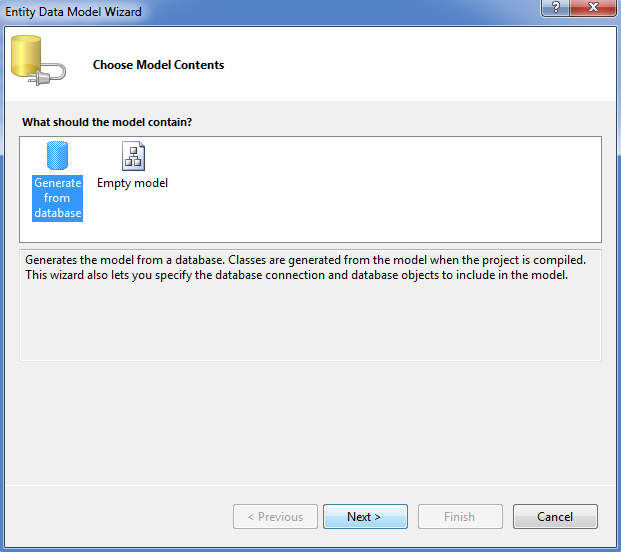 In the "Choose Your Data Connection" section click next. The the next section ("Choose Your Database Objects") check the "Tables" and "Stored Procedures" checkboxes and click "Finish".
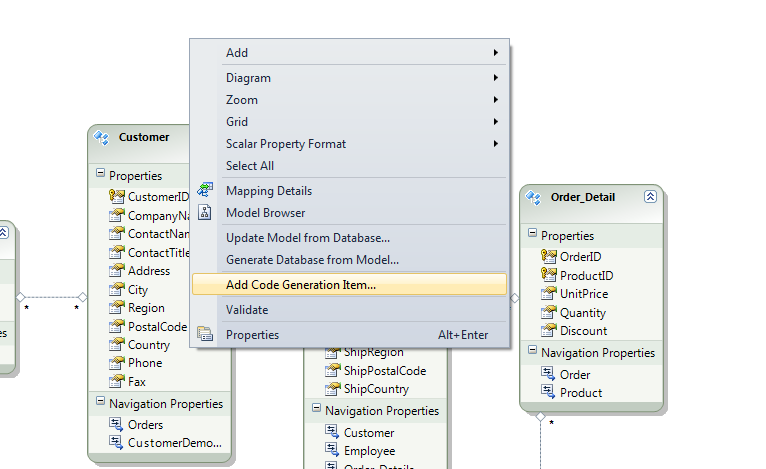
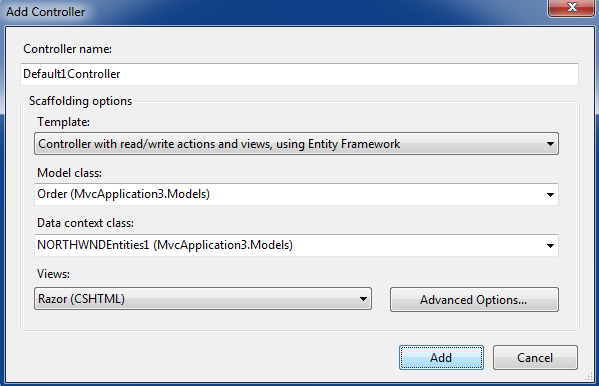
public JsonResult GetOrders(){var orders = db.Orders.ToList<Order>();var orderDetails = db.Order_Details.ToList<Order_Detail>();var products = db.Products.ToList<Product>();var result = (from d in orderDetailsjoin o in orders on d.OrderID equals o.OrderIDjoin p in products on d.ProductID equals p.ProductIDselect new { o.OrderDate, d.Quantity, p.ProductName }).Take(50);return Json(result, JsonRequestBehavior.AllowGet);}
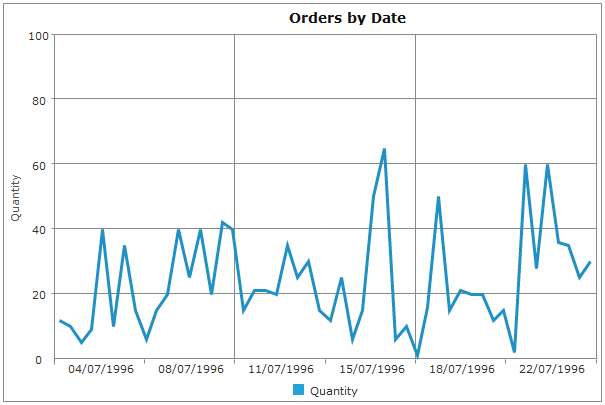
<script type="text/javascript">$(document).ready(function () {var source ={datatype: "json",datafields: [{ name: 'OrderDate', type: 'date' },{ name: 'Quantity' },{ name: 'ProductName' }],url: 'Orders/GetOrders'};var dataAdapter = new $.jqx.dataAdapter(source,{autoBind: true,async: false,downloadComplete: function () { },loadComplete: function () { },loadError: function () { }});// prepare jqxChart settingsvar settings = {title: "Orders by Date",showLegend: true,padding: { left: 5, top: 5, right: 5, bottom: 5 },titlePadding: { left: 90, top: 0, right: 0, bottom: 10 },source: dataAdapter,categoryAxis:{text: 'Category Axis',textRotationAngle: 0,dataField: 'OrderDate',formatFunction: function (jsonDate) {var offset = new Date().getTimezoneOffset() * 60000;var parts = /\/Date\((-?\d+)([+-]\d{2})?(\d{2})?.*/.exec(jsonDate);if (parts[2] == undefined)parts[2] = 0;if (parts[3] == undefined)parts[3] = 0;return $.jqx.dataFormat.formatdate(new Date(+parts[1] + offset + parts[2]*3600000 + parts[3]*60000), 'dd/MM/yyyy');},showTickMarks: true,tickMarksInterval: Math.round(dataAdapter.records.length / 6),tickMarksColor: '#888888',unitInterval: Math.round(dataAdapter.records.length / 6),showGridLines: true,gridLinesInterval: Math.round(dataAdapter.records.length / 3),gridLinesColor: '#888888',axisSize: 'auto'},colorScheme: 'scheme05',seriesGroups:[{type: 'line',valueAxis:{displayValueAxis: true,description: 'Quantity',//descriptionClass: 'css-class-name',axisSize: 'auto',tickMarksColor: '#888888',unitInterval: 20,minValue: 0,maxValue: 100},series: [{ dataField: 'Quantity', displayText: 'Quantity' }]}]};$('#jqxChart').jqxChart(settings);});</script><div id="jqxChart" style="width: 600px; height: 400px;"></div>
public static void RegisterRoutes(RouteCollection routes){routes.IgnoreRoute("{resource}.axd/{*pathInfo}");routes.MapRoute("Orders", // Route name"{controller}/{action}/{id}", // URL with parametersnew { controller = "Orders", action = "Index", id = UrlParameter.Optional } // Parameter defaults);}
